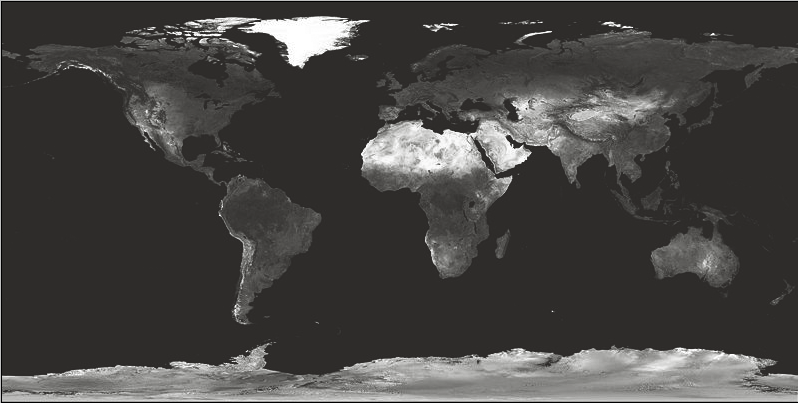
HLA » Haplotype Frequency Distribution
| Colour scale |
| 0 | 10% | 25% | 100% | ||||||||||||||||||||||||||||||||||||||
|
Notes: Frequencies plotted in this map correspond to the incidence of the haplotype in populations where demographic data was available. Some of the populations may have been sampled in the same area by different groups. Thus, frequencies (colour pixels) may be overlaid in small areas (E.g. Many populations available in Europe). The criteria for the overlay is from 0%->100%. Therefore, highest frequencies are shown on top. If you mouse over a specific coordinate you can visualise the demographic data of the population. Important: If you are searching a haplotype using alleles at low resolution (e.g. A*02-B*15) you may also get haplotype results from these alleles at higher resolutions (e.g. A*02:01-B*15:10) which will obviously contain lower frequencies. The same mechanism applies when you are including two loci (e.g. A*02-B*15) and data on the AFND is available only for 3,4,5,n loci (e.g. A*02-B*15-DRB1*15). When more data is available we will omit these criteria. |
|||||||||||||||||||||||||||||||||||||||||
Notes: Diagrams are limited to 40 populations by geographic region for a better display.
Important: If you are searching a haplotype using alleles at low resolution (e.g. A*02-B*15) you may also get haplotype results from these alleles at higher resolutions (e.g. A*02:01-B*15:10) which will obviously contain lower frequencies. The same mechanism applies when you are including two loci (e.g. A*02-B*15) and data on the AFND is available only for 3,4,5,n loci (e.g. A*02-B*15-DRB1*15). When more data is available we will omit these criteria.

